
Track how your sprints are going
Planning tells you what you committed to. Tracking tells you whether that commitment held, across every sprint that has closed.
It exists to answer a question a single sprint cannot: are your estimates good enough to plan against?
Open Tracking
- Open your Jira project and select Board Planning in the sidebar.
- Select Tracking.
The button appears once the project has at least one plan.
How the data gets there
Capacity Compass takes a snapshot when a sprint starts and another when it closes. Tracking is built from those snapshots.
Two things follow from that. Only closed sprints appear, and editing a plan after its sprint has started does not rewrite what the start snapshot recorded. Tracking keeps the capacity captured at sprint start as the commitment.
If you see No closed sprints yet, nothing has closed since Capacity Compass was set up. Close a sprint and it appears.
Choose what you are looking at
Two switches sit above everything.
Sprints and People choose the view. Sprints looks at how each sprint landed. People looks at how the load was spread across individuals.
The range selector limits how far back to look: the past 3, 6, or 12 months.
The Sprints view
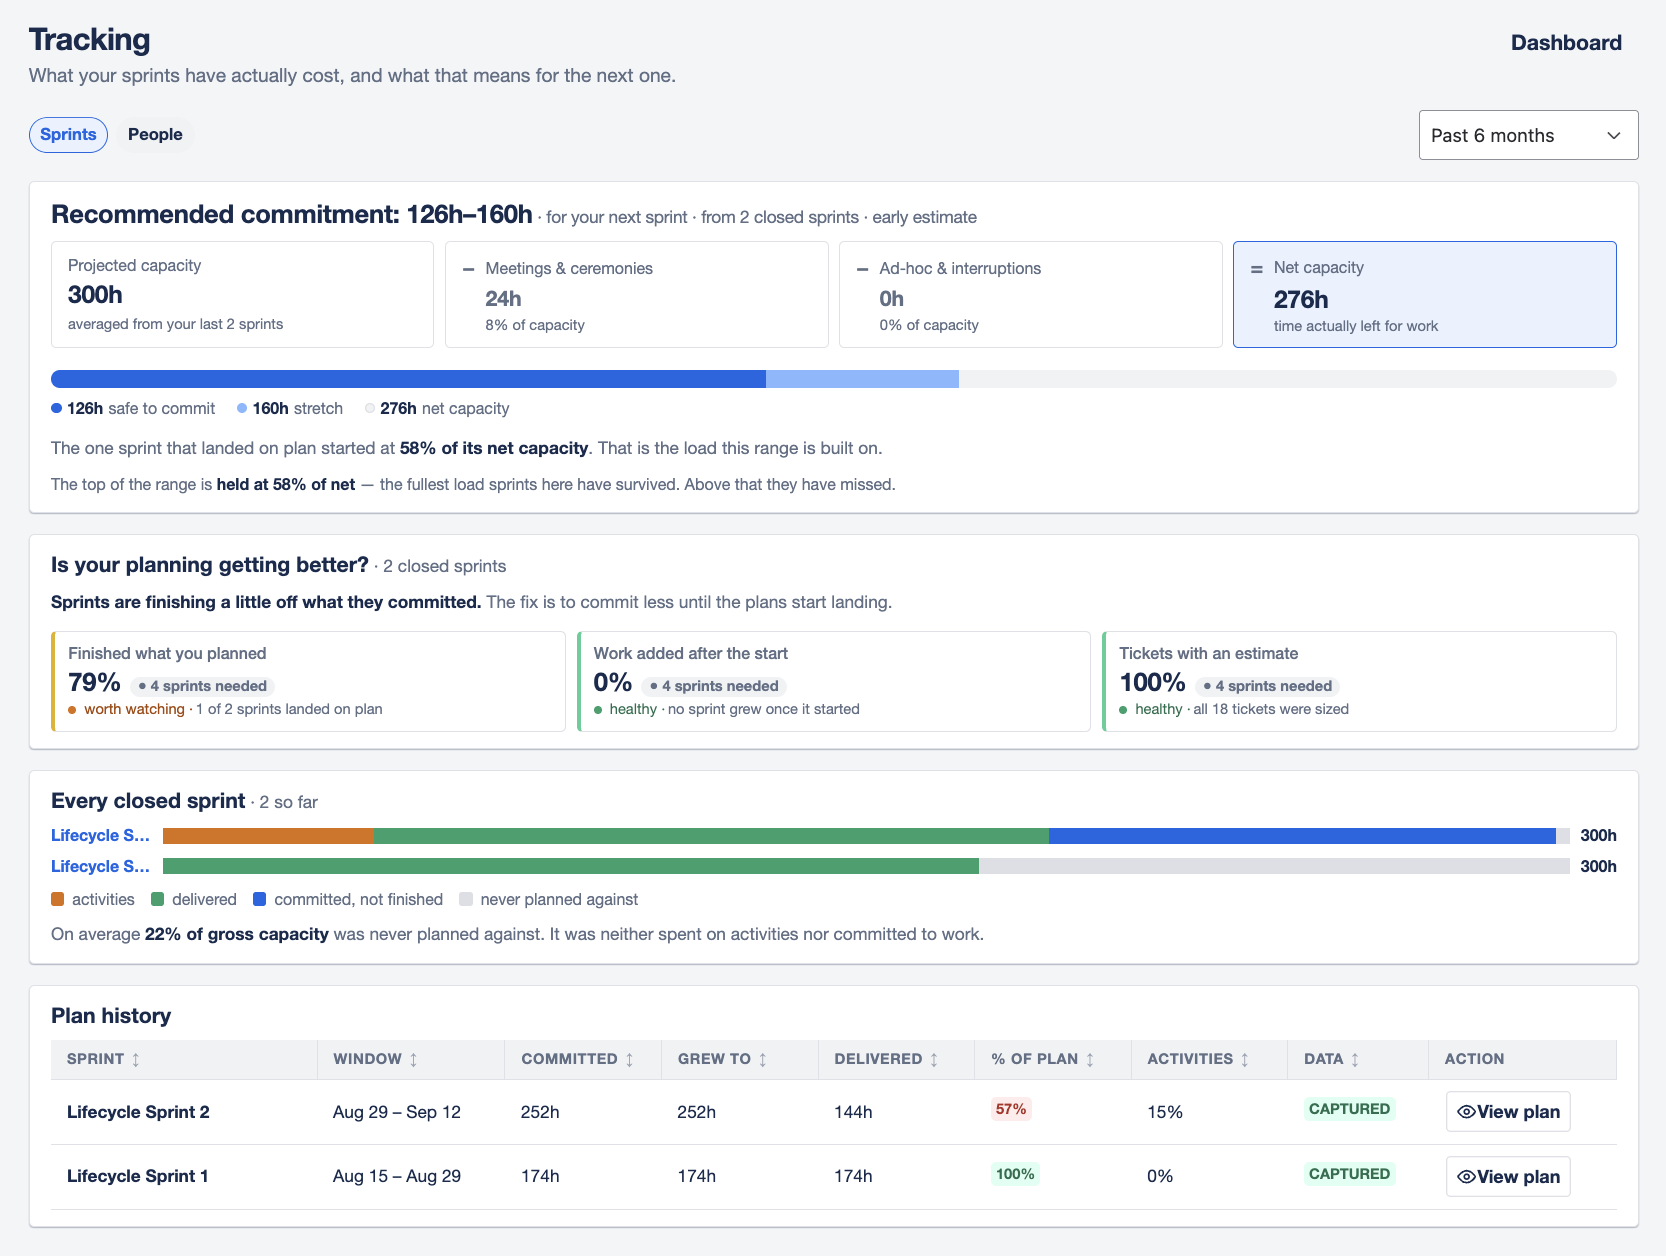
Is your planning getting better?
Three measures across the range:
| Measure | What it tells you |
|---|---|
| Finished what you planned | The share of each sprint's own commitment that got completed. |
| Work added after the start | How much work arrived once the sprint was already running. |
| Tickets with an estimate | The share of tickets that entered the sprint already sized. An unsized ticket is capacity you committed blind. |
How your sprints have drifted
Each closed sprint plotted against what it committed to. Sprints are marked as having landed on plan, missed the plan, or committed work that was not finished.
Capacity Compass states a finding in words above the chart, for example that sprints are finishing a long way from what they committed, or that work keeps getting added after the sprint has started.
How full is too full
This compares the load each sprint carried against whether it landed. Over enough sprints it shows where your team's real ceiling is, rather than where you assumed it was.
Once there is enough history, Capacity Compass recommends a commitment range in hours. Until then it says how many more sprints are needed before a forecast is possible, rather than offering one built on too little evidence.
Estimate bias
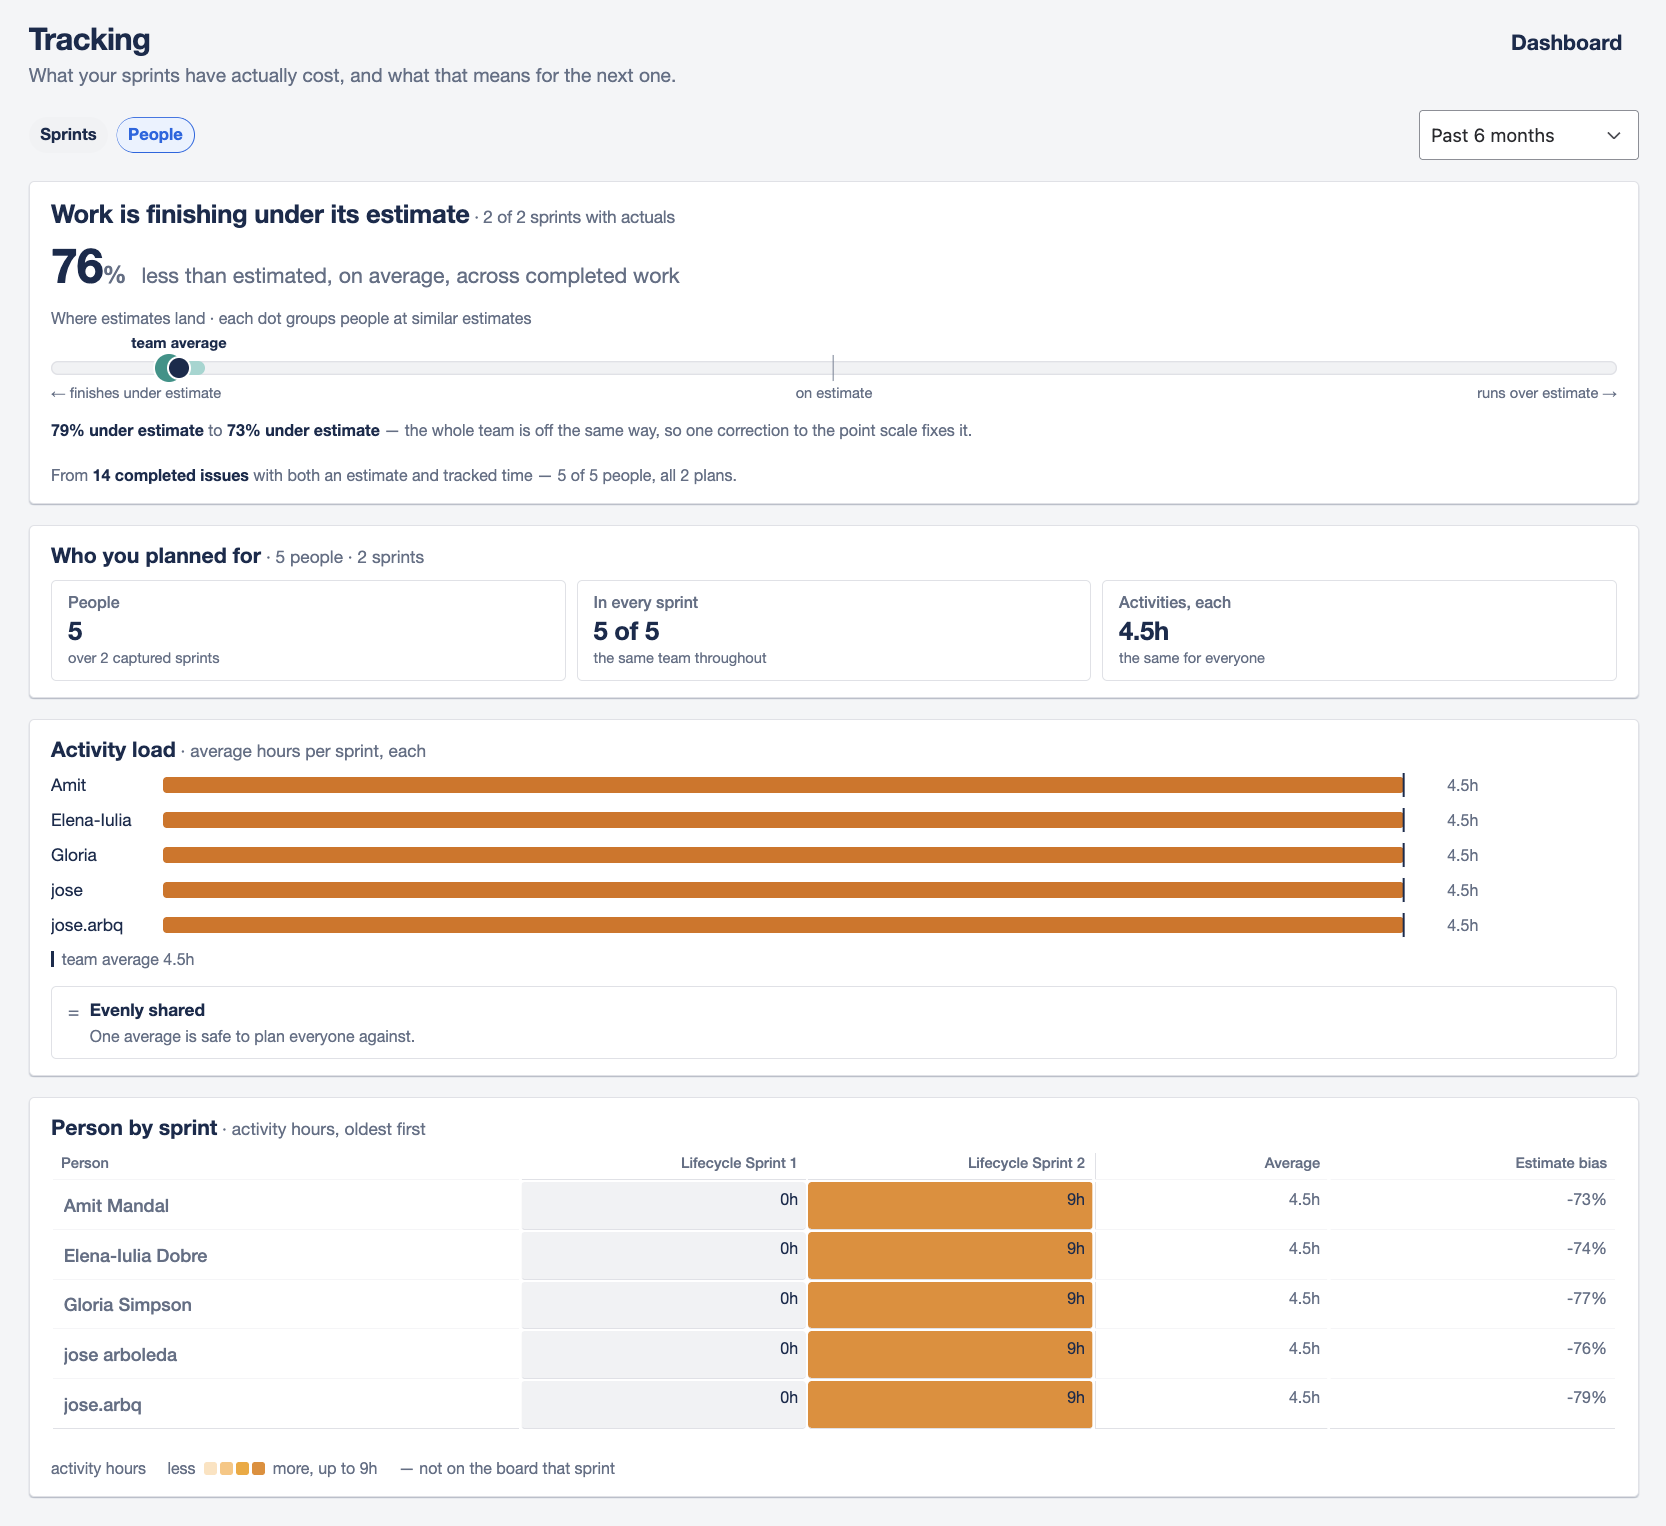
Whether work consistently takes longer or less time than estimated.
Bias uses only completed work that has both an estimate and tracked time, so it needs actual time configured on the plan. If it is not, Capacity Compass tells you to configure worklogs or a tracked time field rather than showing an empty chart.
Readings include your estimates being close enough to plan against as they stand, work taking longer than estimated, work finishing under its estimate, and estimates varying widely across the team. The last one matters most: a team whose estimates are inconsistent cannot be planned with one average.
Plan history
Every closed sprint in the range, one per row, with its outcome. Paged when there are many.
The People view
The same history seen per person. Use it to check whether load and meeting time are shared evenly.
Team calibration
Where each person's estimates land. Capacity Compass states whether one average is safe to plan everyone against, or whether one average overstates some people and understates others.
That distinction decides whether a single team wide conversion is honest. When estimates vary widely between people, planning everyone at the same rate builds an error into every sprint.
Activity load
Average hours per person per sprint spent on meetings, ceremonies, and ad-hoc work. Capacity Compass says whether that load is evenly shared or uneven.
This is the number to deduct before planning, not after.
Who you planned for
Everyone who appeared in a captured close snapshot in the range, whether or not they were assigned work, including how many sprints each person appeared in and their average activity hours.
Someone who joined partway through is marked as such, so their lower totals are not read as lower output.
Person by sprint
Activity hours per person per sprint, oldest first. The grid behind the averages.
What Tracking is not
Tracking measures whether sprints landed where they were planned. It is not a performance review tool, and it has no per person delivery or velocity ranking.
Where individuals appear, it is to show how load and meeting time were distributed, which is a planning question.
Reading averages carefully
If the range covers a period where the team changed substantially, Capacity Compass warns that averages cover more than one team and points you at the per person grid before planning against them.
A sprint that only partly captured its snapshots is marked Partial, so a gap in the data is visible rather than silently averaged in.